


Tame price monster smirks
On face value, the price monster might have been more lenient last year than in 2017, but a closer look at the figures show the consumer was hurt where it matters a lot.
Jo-Maré Duddy
Although Namibians enjoyed significant inflation relief last year in the two heavyweights in the consumer basket compared to 2017, they had to endure bigger price pressure in the remaining two.
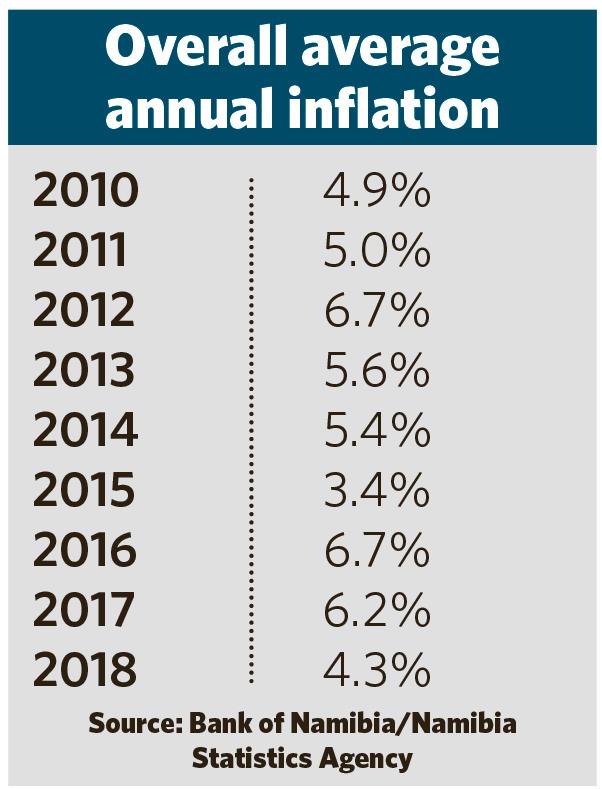
December's overall inflation figure of 5.1% released by the Namibia Statistics Agency (NSA) on Tuesday means an average overall annual inflation rate of 4.3% in 2018, down from 6.2% the previous year and the lowest since 2015.
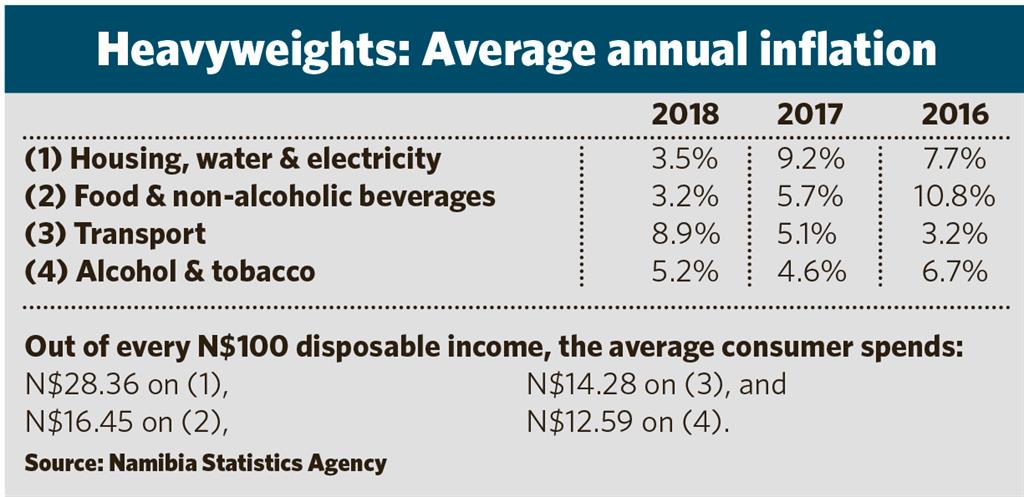
Average annual inflation for the two heaviest items in the consumer basket – housing, water and electricity, as well as food and non-alcoholic beverages – came in significantly lower than in 2017. Together, the average consumer spends nearly 45% of disposable income on these goods and services.
The average annual rates for transport, as well as alcohol and tobacco, however showed sizeable increases compared to 2017. Nearly 27% of disposable income is used for these products and services.
Food
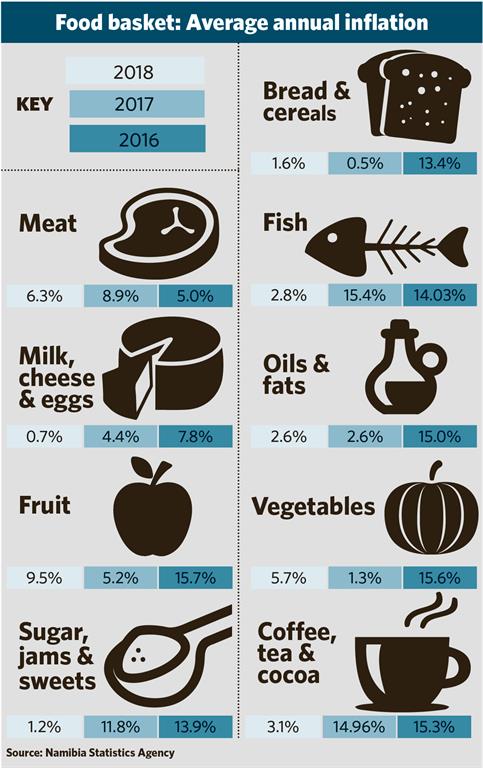
Average annual food inflation, excluding non-alcoholic beverages, for 2018 was 3.3%, two percentage points down from 2017. It started off at 1.7% and increased gradually until it spiked to 4.9% in November. In December annual food inflation jumped to 5.4%.
Sub-categories which spent time in deflationary territory last year include bread and cereals, fish, milk, cheese and eggs, as well as sugar and sugary foods and mineral waters, soft drinks and juices.
For the year, fish inflation dropped the most – from an average of 15.4% in 2017 to 2.8%.
Annual inflation for staple foods such as bread and cereals, however, edged up from 0.5% in 2017 to 1.6%. Fruit and vegetables also didn't escape the price monster's claws. Average annual fruit inflation was 9.5% compared to 5.2% in 2017, while vegetables recorded a rate of 5.7% compared to 1.3%.
Housing
The huge drop of 5.7 percentage points in the average annual inflation rate for housing, water and electricity was on account of big relief in the figure for rent. With properties becoming more affordable to rent last year, the average annual inflation rate for this sub-category came in at 2.6%. In 2017, it was 9.8%.
The other sub-categories experienced relief too. The rate for electricity, gas and other fuels was 7.5% compared to 7.7% in 2017. Average annual inflation for municipal services for 2018 was 6.5%, down from 10.4% in 2017. The rate for regular maintenance and repairs of property came in at 3.1% compared to 6.5% in 2017.
Transport
Massive hikes in the fuel price and taxi fares last year drove average overall annual transport inflation up from 5.1% in 2017 to 8.9% in 2018.
The inflation rate for operation of personal transport equipment – which includes the fuel price – started off 2018 at 5.2%, moved into double-digit territory last July and peaked at 15.5% in October. By December it had slacked down to 10.5%, following decreases in the fuel price. The overall rate for 2018 was 10.1% compared to 6.5% the previous year.
An increase in taxi fares last August lead to the rate for public transport services spiking to 18% the following month. Inflation for this sub-category started 2018 at 1.5% and ended December at 18.2%. The average rate for 2018 was 7.2% compared to -0.2% in 2017.
Alcohol, tobacco
Drowning your economic sorrows came at a price last year. The average annual inflation rate for alcoholic drinks was 5.7%, up from 4.8% in 2017. Bacchus inflation started at 4.4% last January and brewed to end December at 6.1%.
Inflation for tobacco burned at a lower flame. The average rate for 2018 was 2.99%, down from 3.9% the previous year.
Although Namibians enjoyed significant inflation relief last year in the two heavyweights in the consumer basket compared to 2017, they had to endure bigger price pressure in the remaining two.
December's overall inflation figure of 5.1% released by the Namibia Statistics Agency (NSA) on Tuesday means an average overall annual inflation rate of 4.3% in 2018, down from 6.2% the previous year and the lowest since 2015.
Average annual inflation for the two heaviest items in the consumer basket – housing, water and electricity, as well as food and non-alcoholic beverages – came in significantly lower than in 2017. Together, the average consumer spends nearly 45% of disposable income on these goods and services.
The average annual rates for transport, as well as alcohol and tobacco, however showed sizeable increases compared to 2017. Nearly 27% of disposable income is used for these products and services.
Food
Average annual food inflation, excluding non-alcoholic beverages, for 2018 was 3.3%, two percentage points down from 2017. It started off at 1.7% and increased gradually until it spiked to 4.9% in November. In December annual food inflation jumped to 5.4%.
Sub-categories which spent time in deflationary territory last year include bread and cereals, fish, milk, cheese and eggs, as well as sugar and sugary foods and mineral waters, soft drinks and juices.
For the year, fish inflation dropped the most – from an average of 15.4% in 2017 to 2.8%.
Annual inflation for staple foods such as bread and cereals, however, edged up from 0.5% in 2017 to 1.6%. Fruit and vegetables also didn't escape the price monster's claws. Average annual fruit inflation was 9.5% compared to 5.2% in 2017, while vegetables recorded a rate of 5.7% compared to 1.3%.
Housing
The huge drop of 5.7 percentage points in the average annual inflation rate for housing, water and electricity was on account of big relief in the figure for rent. With properties becoming more affordable to rent last year, the average annual inflation rate for this sub-category came in at 2.6%. In 2017, it was 9.8%.
The other sub-categories experienced relief too. The rate for electricity, gas and other fuels was 7.5% compared to 7.7% in 2017. Average annual inflation for municipal services for 2018 was 6.5%, down from 10.4% in 2017. The rate for regular maintenance and repairs of property came in at 3.1% compared to 6.5% in 2017.
Transport
Massive hikes in the fuel price and taxi fares last year drove average overall annual transport inflation up from 5.1% in 2017 to 8.9% in 2018.
The inflation rate for operation of personal transport equipment – which includes the fuel price – started off 2018 at 5.2%, moved into double-digit territory last July and peaked at 15.5% in October. By December it had slacked down to 10.5%, following decreases in the fuel price. The overall rate for 2018 was 10.1% compared to 6.5% the previous year.
An increase in taxi fares last August lead to the rate for public transport services spiking to 18% the following month. Inflation for this sub-category started 2018 at 1.5% and ended December at 18.2%. The average rate for 2018 was 7.2% compared to -0.2% in 2017.
Alcohol, tobacco
Drowning your economic sorrows came at a price last year. The average annual inflation rate for alcoholic drinks was 5.7%, up from 4.8% in 2017. Bacchus inflation started at 4.4% last January and brewed to end December at 6.1%.
Inflation for tobacco burned at a lower flame. The average rate for 2018 was 2.99%, down from 3.9% the previous year.
Comments
Namibian Sun
No comments have been left on this article